Static Image
Pre-rendered PNG from GCS. Fast loading, print-friendly.
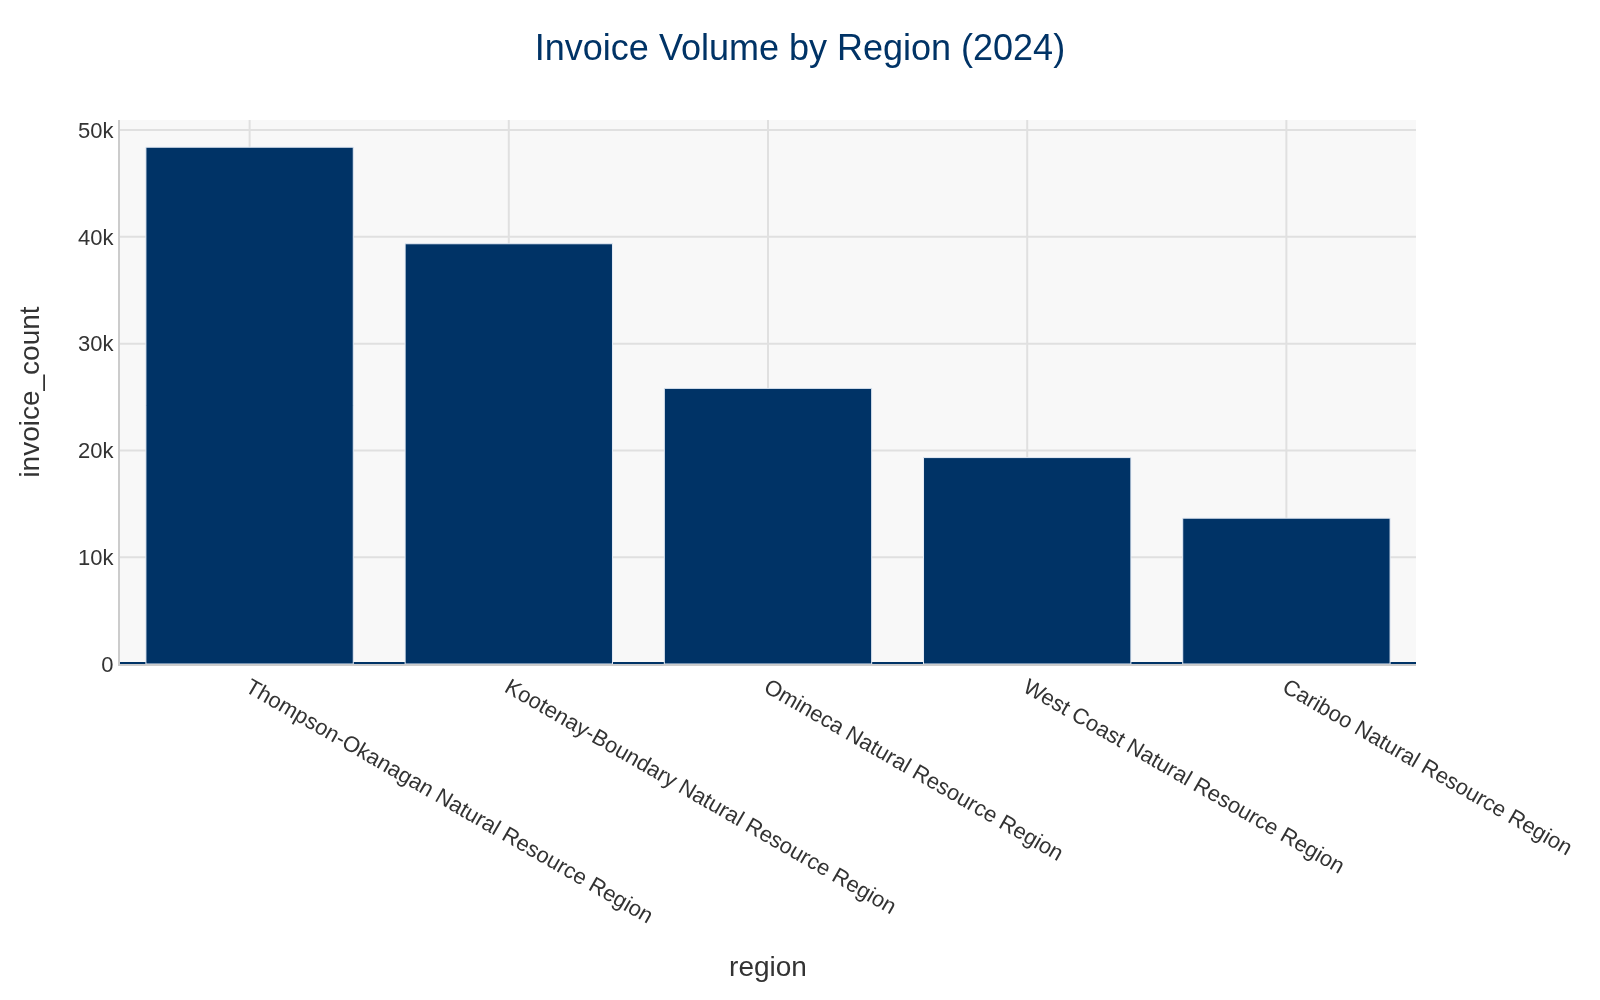
Static PNG
Embedding live charts from plotly-styles-mcp and tables from gt-styles-hbs into zero-dependency presentations
Choose based on your presentation needs
| Feature | Interactive (figure_html) | Static (image_url) |
|---|---|---|
| Hover tooltips | Yes | No |
| Zoom/Pan | Yes | No |
| File size | Larger (JS included) | Smaller (PNG) |
| Offline use | Requires CDN or bundled | Works offline |
| Best for | Data exploration | Print/Export |
Hover over bars for details. Zoom and pan supported.
Pre-rendered PNG from GCS. Fast loading, print-friendly.
MCP returns structured data you can drop directly into slides
// plotly-styles-mcp returns:
{
  "figure_html": "<div>...Plotly chart...</div>",
  "image_url": "https://storage.googleapis.com/...",
  "figure_json": { /* for client-side render */ }
}
<!-- Interactive: paste figure_html -->
<div id="chart"></div>
<script>Plotly.newPlot("chart", data, layout);</script>

<!-- Static: use image_url -->
<img src="${image_url}" alt="Chart">
Combine BigQuery data, professional styling, and animated presentations in one workflow